













- Home
- Blogs
- Internet of Things
- Optical heart rate measurement principle
Optical heart rate measurement principle
Introduction
In this era where everything must be connected with "smartness", in addition to our common mobile phones, there are also some wearable devices such as smart watches and bracelets. These smart wearable devices integrate many sensors. Since pulse or heart rate is one of the important parameters of vital signs, heart rate measurement can be regarded as a necessary skill for high-end entry-level products. Recently, I have had the opportunity to study the technology of heart rate measurement, so To strike while the iron is hot, let’s summarize the relevant knowledge about optical heart rate measurement.
I have collected a lot of information on the Internet. Currently, there are the following sensor technologies for heart rate measurement (for reference only)
1. ECG
2. Photoplethysmography PPG
3. bioimpedance bioimpedance
4. Camera Camera RGB, wifi and other technologies
Among the above methods, the most familiar one is probably electrocardiogram. In the medical field, electrocardiogram (ECG) is usually used to measure physiological electrical signals to detect heart rate and cardiac activity. However, due to measuring ECG signals, sensor electrodes are often connected to multiple parts of the body, and up to 10 electrodes can be connected between the chest and limbs. Although ECG signals are accurate and informative, ECG technology has not been widely used in wearable devices due to their portability and simple functions. At present, ECG is still used in some professional fields, such as hospitals and sports.
The second type of photoplethysmography, the name sounds really high-end. In fact, to put it simply, it is a technology that uses light to measure pulse. This technology is currently widely used, and this article mainly introduces this technology.
Currently, wearable devices using this technology can be seen on the market: Apple Watch, Microsoft Band, etc.....

As for the third bioimpedance sensor measurement method, the only one currently on the market seems to be Jawbone's UP3. There is very little information on this technology online. However, through personal experience and trial use of Jawbone UP3, I feel that this technology should be more difficult than optical heart rate measurement technology but should be more accurate and reliable. The last Camera RGB and wifi are new technologies developed by MIT, and they look very high-end. One of them is to detect changes in human body signs through the camera of our mobile phones. This technology is very interesting and high-end. If you are interested, you can watch the video introduction. The other one can be measured through the wifi signal in our home, which is also very high-end. Of course, these two products have not yet been launched on the market, so I won’t say more about them.
Photoplethysmography PPG
Optical heart rate sensors are not unusual for those of you who have worn the above-mentioned smart watches or smart bracelets. Take the Apple Watch as an example. When measuring heart rate, the dial at the bottom will emit a green light, and it is best to keep your wrist still when measuring, otherwise it will affect the measurement results. Next, the principle of optical heart rate measurement will be introduced in detail.
The picture below is an optical heart rate sensor.
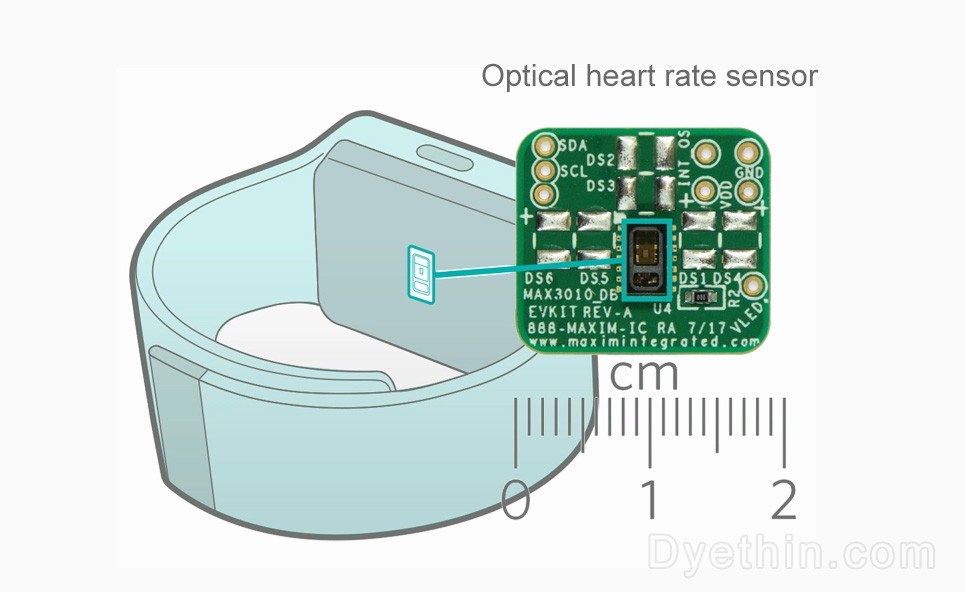
So why can heart rate be measured by LED lights?
When the LED light shines on the skin, the light reflected back through the skin tissue is received by the photosensitive sensor and converted into an electrical signal and then converted into a digital signal through AD. The process is simplified: light --> electricity --> digital signal
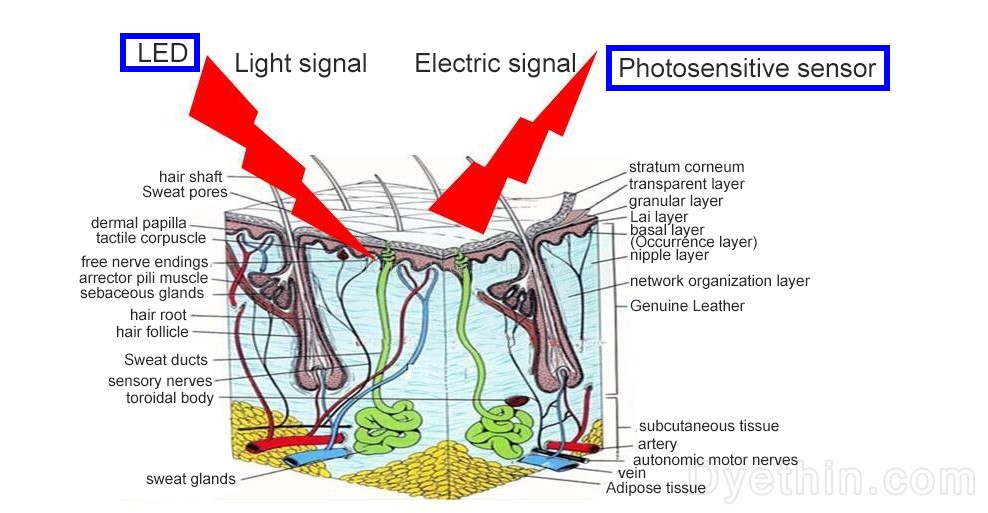
Why do most sensors use green light?
Let’s first look at the characteristics of the spectrum. The wavelengths from ultraviolet to infrared are getting longer and longer.
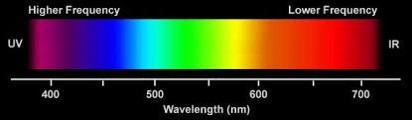
The reason why we choose green light as the light source is to consider several characteristics:
1. The melanin in the skin absorbs a large number of waves with shorter wavelengths
2. The moisture on the skin will also absorb a large amount of UV and IR light
3. Most of the green light (500nm) entering the skin tissue-yellow light (600nm) will be absorbed by red blood cells
4. Red light and light close to IR pass through skin tissue more easily than light of other wavelengths
5. Blood absorbs more light than other tissues
6. Compared with red light, green (green-yellow) light can be absorbed by oxyhemoglobin and deoxygenated hemoglobin
Generally speaking, green light-red light can be used as measurement light sources. In the early days, most used red light as the light source. With further research and comparison, green light as the light source has better signals and a better signal-to-noise ratio than other light sources. Therefore, most wearable devices now use green light as the light source. However, considering the different skin conditions (skin color, sweat), high-end products will automatically switch to green, red and IR light sources according to the situation.
Although we know the above characteristics, it is not enough to figure out why heart rate, blood oxygen and other parameters can be measured through light?
The following figure explains the core principle
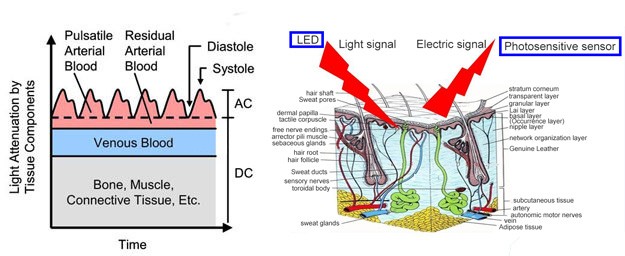
When light passes through skin tissue and then reflects to the photosensitive sensor, there is a certain attenuation of the light. The absorption of light by muscles, bones, veins and other connecting tissues is basically unchanged (provided that the measurement site does not move significantly), but blood is different. Since there is blood flow in the arteries, the absorption of light Nature has also changed. When we convert light into electrical signals, it is precisely because the absorption of light by arteries changes and the absorption of light by other tissues remains basically unchanged that the resulting signals can be divided into direct current DC signals and alternating current AC signals. Extracting the AC signal can reflect the characteristics of blood flow. We call this technique photoplethysmography (PPG).
The picture below is a comparison of PPG signal and ECG signal
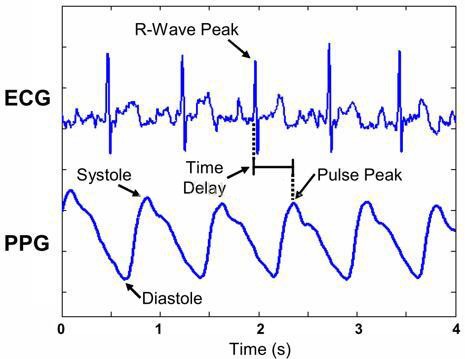
The actual measured PPG signal of the finger is as follows:
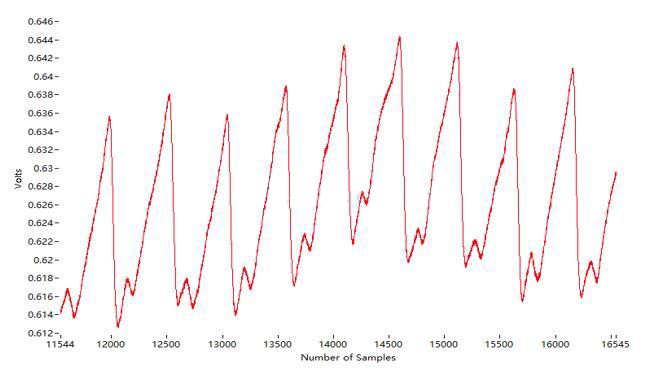
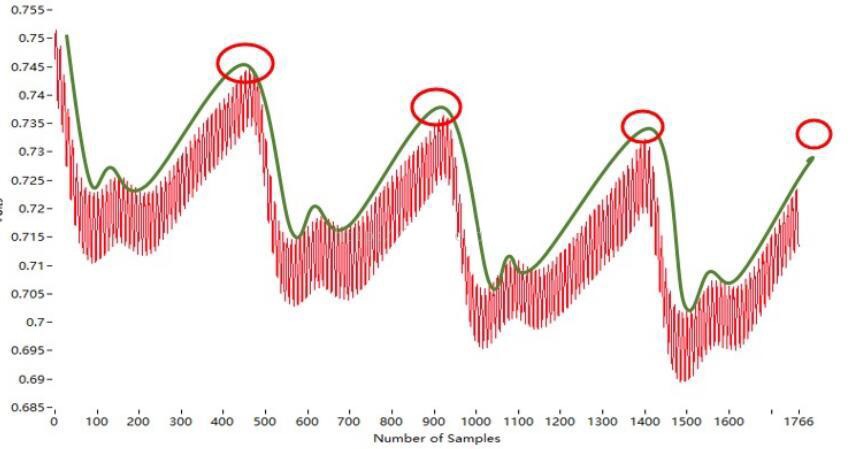
Therefore, it is not difficult to calculate the heart rate as long as the measured PPG signal is ideal. But the reality is always cruel. Due to the movement of the measurement part, natural light, fluorescent lamps and other interferences, the final measured signal may be as follows, so many methods must be used for filtering.
For PPG signal processing, I currently know of two methods. One is time domain analysis, which is to calculate the number of peaks of the PPG signal within a certain period of time, and the other is to obtain the frequency domain characteristics by performing FFT transformation on the PPG signal.
Time domain method
By filtering the original {PPG signal, the number of peaks within a certain period of time is obtained, and then the heart rate value can be calculated.
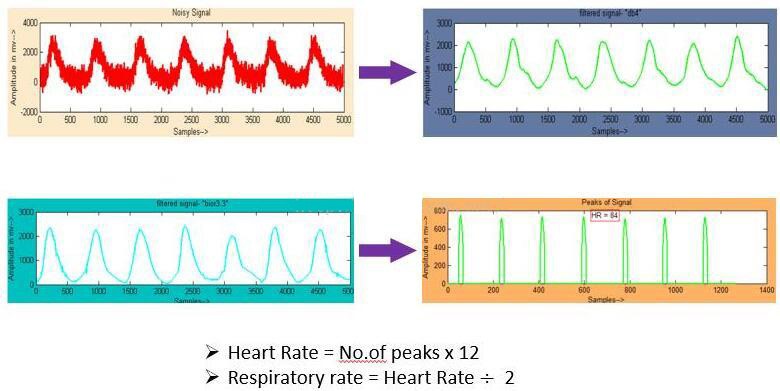
Assuming continuous sampling for 5 seconds, the number of wave peaks within 5 seconds is N, then the heart rate is N*12 (I believe everyone knows this, it is just like feeling the pulse~)
Frequency domain analysis
As analyzed above, we converted the light absorption of blood flow into AC signals. If we perform FFT transformation, we can see the characteristics of the frequency domain. The figure below shows the FFT transformation of the PPG signal.
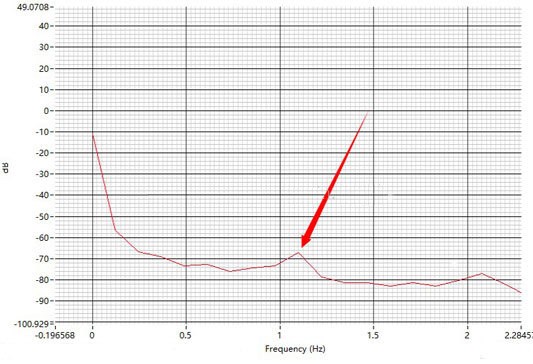
In the frequency domain diagram above, the signal at 0Hz is very strong. This part is the DC signal of bones, muscles and other tissues. There is a relatively prominent signal near 1Hz, which is the AC signal of blood flow changes. Assume that the measured frequency f = 1.2Hz
Then heart rateHeartRate HR = f x60 = 1.2 x 60 = 72
Finally, let me briefly mention blood oxygen measurement. Compared with heart rate and blood oxygen measurement, it is more difficult and the accuracy is not too high. The principle diagram of measuring blood oxygen is shown in the figure below
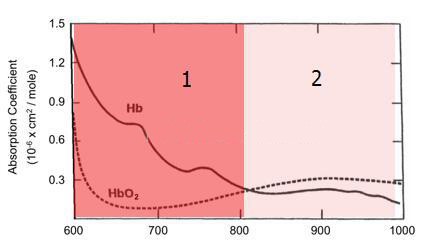
Since there is a certain ratio between oxygenated hemoglobin HbO2 and hemoglobin Hb contained in the blood, it is simply the oxygen content. The above figure shows the light absorption characteristics of oxyhemoglobin HbO2 and hemoglobin Hb for wavelengths of 600 to 1000 nm. It can be seen from the figure that the absorption coefficient of Hb is higher between 600 and 800 nm, and the absorption coefficient of HbO2 is higher between 800 and 1000 nm. high. Therefore, red light (600~800nm) and light close to IR (800~1000nm) can be used to detect the PPG signals of HbO2 and Hb respectively, and then the corresponding ratio can be calculated through program processing, thus obtaining the blood oxygen value.
However, due to different light sources, it is unreliable to directly use red light and light close to IR for signal comparison, because red light and IR will also produce different absorption when transmitted through skin tissue. The picture below is a schematic diagram of the original signals of red light and IR penetrating the skin.
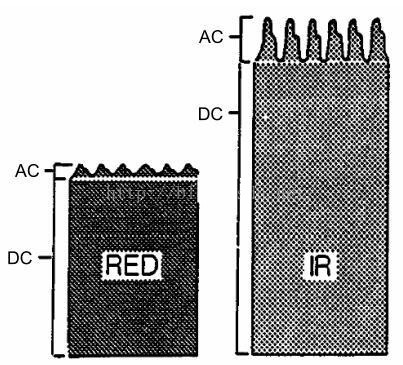
As analyzed above, the DC part is the direct current signal converted by light through the skin tissue, and the AC part is the alternating current signal converted by the blood flow. Since skin tissue absorbs red light and IR to different degrees, the DC part is naturally different. In order to "fairly treat" the PPG signals of the two light sources, the original signals need to be processed. The figure below illustrates the processed signal (DC parts are equal)

Through a certain ratio calculation, the PPG signals of Red and IR are treated fairly. The ratio of Hb and HbO2 calculated in this way is reliable.
Articles you may also like
NE555 datasheet and Pinout, NE555 circuits generates square waves

Hall Effect Sensors & Switches
RS485 chip selection and instructions
RS485 chip selection and instructionsRS485 chip selection and instructions